DATA-DRIVEN INSIGHTS: SOLVING
BUSINESS CHALLENGES AT
BRIGG'S COMPANY WITH SQL QUERIES
In this project with Briggs company, I provided valuable insights by answering a range of business questions. The analysis enabled informed decision-making for the company.
Welcome to a comprehensive exploration of SQL queries tailored to solve real-world business problems, all centered around the operations of the fictional Brigg’s Company. In this write-up, we delve into various scenarios faced by the Brigg’s Company, ranging from optimizing product delivery to analyzing customer data for targeted marketing campaigns.
The Brigg’s Company operates in diverse sectors, including entertainment, food services, and retail, presenting a rich tapestry of challenges and opportunities ripe for SQL-based analysis. From assessing movie performance to understanding customer behavior, each SQL query provides valuable insights crucial for informed decision-making within the company.
We’ll journey through a series of SQL queries, each designed to address specific business questions faced by the Brigg’s Company. From examining movie data to analyzing customer demographics and sales performance, these queries serve as powerful tools in deciphering complex business landscapes.
Join us as we uncover actionable insights and solutions tailored to the unique needs of the Brigg’s Company, demonstrating the versatility and effectiveness of SQL in tackling real-world business challenges head-on. Let’s dive into the world of data-driven decision-making and witness firsthand how SQL empowers organizations to thrive in today’s competitive landscape.
BUSINESS PROBLEMS AND SOLUTIONS
Question 1
Problem: Using the Movie Data, write a query to show the titles and movies released in 2017 whose vote count is more than 15 and runtime is more than 100.
SQL Query:
select original_title
FROM [MOVIES].[dbo].[‘Movie Data$’]
where [release__Date] = 2017 AND vote_count > 15 AND runtime >100;
Output:

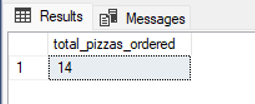
Question 2
Problem: Using the Pizza Data, write a query to show how many Pizzas were ordered
SQL Query:
select count (order_id) as total_pizzas_ordered
FROM [Bread_Data].[dbo].[customer_orders];
Output:
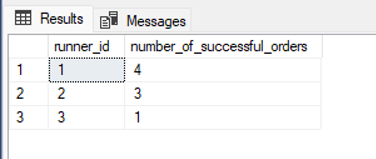
Question 3
Problem: Using the Pizza data, write a query to show how many successful orders were delivered by each runner
SQL Query:
select distinct [runner_id], count(runner_id) as number_of_successful_orders
FROM [Bread_Data].[dbo].[runner_orders]
where cancellation is null
group by runner_id;
Output:
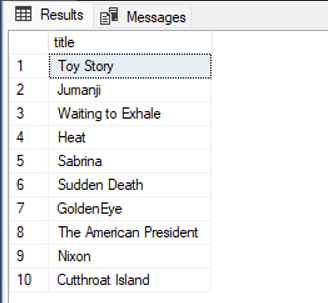
Question 4
Problem: Using the Movie Data, write a query to show the top 10 movie titles whose language is English and French and the budget is more than 1,000,000
SQL Query:
Select top (10) title
FROM [MOVIES].[dbo].[‘Movie Data$’]
where original_language in (‘en’,’fr’) AND [ budget ] > 1000000;
Output:
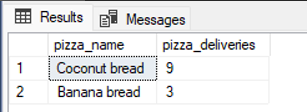
Question 5
Problem: Using the Pizza Data, write a query to show the number of each type of pizza was delivered
SQL Query:
select distinct bread_name as pizza_name, count (RO.order_id) as pizza_deliveries FROM [Bread_Data].[dbo].[customer_orders] as CS
inner join bread_names as BN
on CS.pizza_id = BN.bread_id
inner join runner_orders as RO
on CS.order_id = RO.order_id
where cancellation is null
Group by bread_name
order by pizza_deliveries desc;
Output:
Question 6
Problem: The Briggs company wants to ship some of their products to customers in selected cities but they want to know the average days it’ll take to deliver those items to Dallas, Los Angeles, Seattle and Madison. Using sample Superstore data, write a query to show the average delivery days to those cities. Only show the city and average delivery days columns in your output.
SQL Query:
select city, avg (DATEDIFF(DAY,[Order Date],[Ship Date])) as average_delivery_days
FROM [MOVIES].[dbo].[‘Sample-Superstore-Complete$’]
where City in (‘Dallas’, ‘Los Angeles’, ‘Seattle’, ‘Madison’)
group by City;
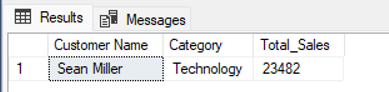
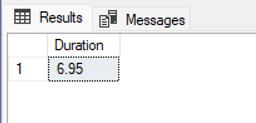
Question 7
Problem: Its getting to the end of the year and The Briggs Company wants to reward the customer who made the highest sales ever. Using the Sample Super Store, write a query to help the company identify this customer and category of business driving the sales. Let your output show the customer name, the category and the total sales. Round the total sales to the nearest whole number.
SQL Query:
Select top (1) [Customer Name], Category, Round(sum (Sales),0) as Total_Sales
FROM [MOVIES].[dbo].[‘Sample-Superstore-Complete$’]
group by [Customer Name], Category
order by sum(Sales) desc;
Output:
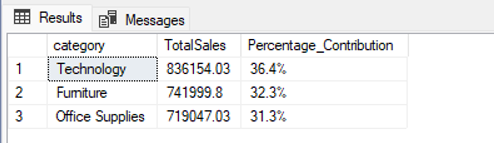
Question 8
Problem: The Briggs company has 3 categories of business generating revenue for the company. They want to know which of them is driving the business. Write a query to show the total sales and percentage contribution by each category. Show category, total sales and percentage contribution columns in your output
SQL Query:
select category,
round(sum(sales), 2) as TotalSales,
(concat(round(sum (sales) / (select sum(sales) from [‘Sample-Superstore-Complete$’]) *100, 2), ‘%’)) as [Percentage_Contribution]
from [‘Sample-Superstore-Complete$’]
group by category
order by [Percentage_Contribution] desc;
Output:
Question 9
Problem: After seeing the Sales by Category, the Briggs company became curious and wanted to dig deeper to see which subcategory is selling the most. They need the help of an analyst. Please help the company to write a query to show the sub category and the Total sales of each sub category. Let your query display only the subcategory and the total sales columns to see which product sells the most
SQL Query:
select [Sub-Category], Round(sum(sales), 2) as [Total Sales]
FROM [MOVIES].[dbo].[‘Sample-Superstore-Complete$’]
Group by [Sub-Category]
Order by sum(sales) desc;
Output:
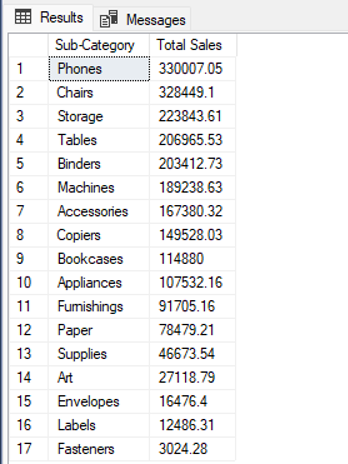
Question 10
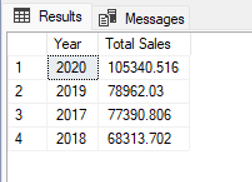
Problem: Now that you’ve identified phones as the business driver in terms of revenue. The company wants to know the total “phone sales” by year to understand how “each year” performed. As the analyst, please help them to show the breakdown of the total sales by year in descending order. Let your output show only Total sales and sales year column
SQL Query:
select datepart(year, [Order Date]) as [Year], sum(sales) as [Total Sales]
FROM [MOVIES].[dbo].[‘Sample-Superstore-Complete$’]
where [Sub-Category] = ‘Phones’
group by datepart(year, [Order Date])
Order by [Total Sales] DESC;
Output:
Question 11
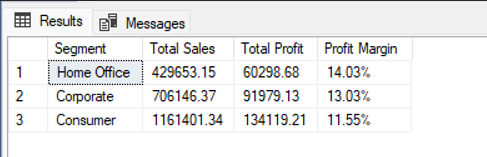
Problem: The Director of Analytics has requested a detailed analysis of the Briggs Company. To fulfil this request, he needs you to generate a table that displays the profit margin of ‘each segment’. The table should include the segments, total sales, total profit and the profit margin. To ensure accuracy, the profit margin should be arranged in descending order
SQL Query:
select Segment, round(sum(sales),2) as [Total Sales], round(sum (profit),2) as [Total Profit],
concat(round(sum(profit)/sum (sales) * 100, 2),’%’) as [Profit Margin]
FROM [MOVIES].[dbo].[‘Sample-Superstore-Complete$’]
Group by Segment
order by [Profit Margin] desc;
Output:
Question 12
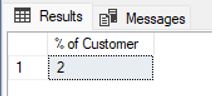
Problem: Your company started consulting for Micro Bank who needs to analyze their marketing data to understand their customers better. This will help them plan their next marketing campaign. You are brought on board as the analyst for this job. They have an offer for customers who are divorced but they need data to back up the campaign. Using the marketing data, write a query to show the percentage of customers who are divorced and have balances greater than 2000.
SQL Query:
Select count([marital]) * 100 / (select count(marital) from [Marketing].[dbo].[‘Marketing data for bank$’]) as [% of Customer]
FROM [Marketing].[dbo].[‘Marketing data for bank$’]
where marital = ‘divorced’ and balance > 2000
group by marital;
Output:
Question 13
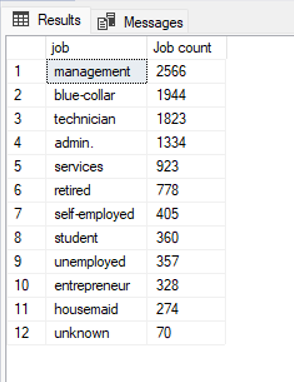
Problem: Micro Bank wants to be sure they have enough data for this campaign and would like to see the total count of each job as contained in the dataset. Using the marketing data, write a query to show the count of each job, arrange the total count in Desc order.
SQL Query:
select job, count (job) as [Job count]
FROM [Marketing].[dbo].[‘Marketing data for bank$’]
Group by job
order by [Job count] desc;
Output:
Question 14
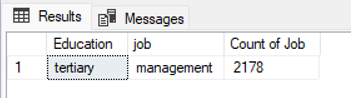
Problem: Just for clarity purposes, your company wants to see which education level got to the management job the most. Using the marketing data, write a query to show the education level that gets the management position the most. Let your output show the education, job and the count of jobs columns.
SQL Query:
select Top (1) education as [Education], job, count (job) as [Count of Job]
FROM [Marketing].[dbo].[‘Marketing data for bank$’]
where job = ‘Management’
Group by education, job
order by [Count of Job] desc;
Output:
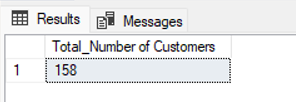
Question 15
Problem: What’s the total number of customers that have housing, loan and are single?
SQL Query:
select count (job) as [Total_Number of Customers]
FROM [Marketing].[dbo].[‘Marketing data for bank$’]
where housing = ‘yes’ and loan =’yes’ and [marital] = ‘single’;
Output:
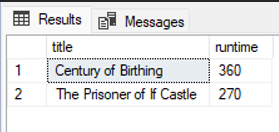
Problem: using the Movie data, write a query to show the movie title and runtime of at least 250. Show the title and runtime columns in your output
SQL Query:
select title, runtime
FROM [MOVIES].[dbo].[‘Movie Data$’]
where runtime >= 250
order by runtime desc;
Output:
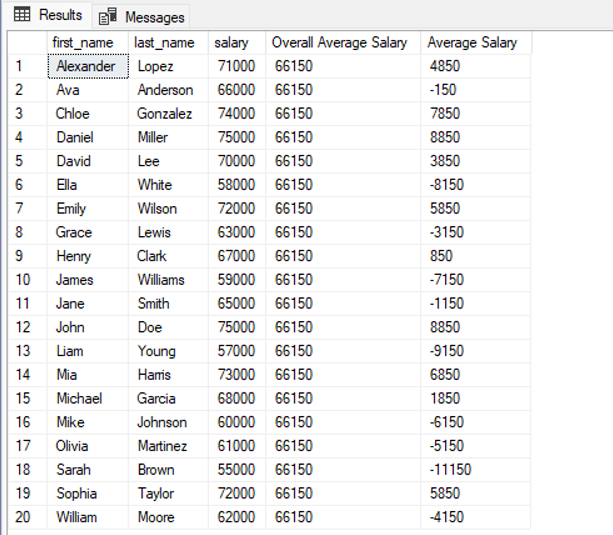
Question 16
Problem: Using the Employee Table dataset, write a query to show all the employees first name and last name and their respective salaries. Also, show the overall average salary of the company and calculate the difference between each employee’s salary and the company average salary
SQL Query:
Select first_name, last_name, salary, avg (salary) over () as [Overall Average Salary], (salary – avg (salary) over ()) as [Average Salary]
FROM [Employee].[dbo].[Employee-Table]
Group by first_name, last_name, salary;
Output:
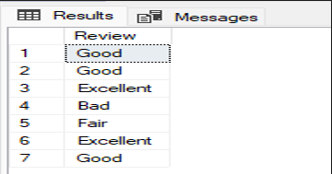
Problem: As we conclude the analysis for The Briggs Company, they got some reviews on their website regarding their new product. Please use the Bonus table to write a query that returns only the meaningful reviews. These are reviews that are readable in English. There are two columns in the table, let your output return only the review column
SQL Query:
select [Review ]
FROM [Marketing].[dbo].[Bonus_Table]
where [translation ]is Null;
Output:
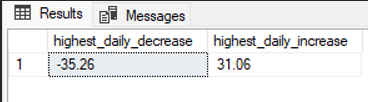
Question 17
Problem: Using the Share Price dataset, write a query to show a table that displays the highest daily decrease and the highest daily increase in share price
SQL Query:
select Round(min([close] – [open]), 2) as highest_daily_decrease, Round(max ([close] – [open]), 2) as highest_daily_increase
FROM [Shareprice].[dbo].[SharePrice];
Output:
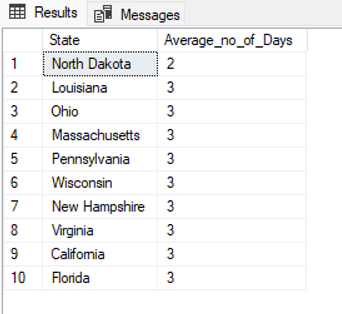
Problem: Our client is planning their logistics for 2024, they want to know the average number of days it takes to ship to the top 10 states. Using the sample superstore dataset, write a query to show the state and the average number of days between the order date and the ship date to the top 10 states
SQL Query:
select top (10) [State], Avg(Datediff(Day,[Order Date], [Ship Date])) as [Average_no_of_Days]
FROM [MOVIES].[dbo].[‘Sample-Superstore-Complete$’]
group by [State]
Order by [Average_no_of_Days] asc;
Output:
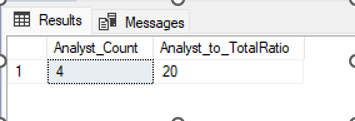
Question 18
Problem: Using the employee table dataset, write a query to show the ratio of the analyst job title to the entire job titles
SQL Query:
select distinct count ([job_title]) as Analyst_Count,
count(job_title) * 100/(select count(job_title) from [Employee].[dbo].[Employee-Table]) as Analyst_to_TotalRatio
FROM [Employee].[dbo].[Employee-Table]
where job_title = ‘Analyst’;
Output:
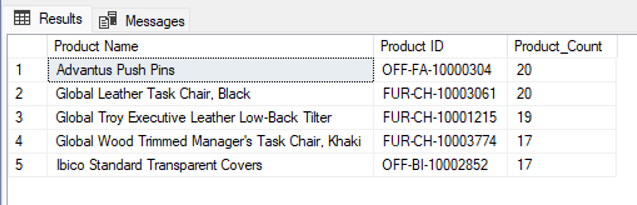
Problem: Your company received a lot of bad reviews about some of your products lately and the management wants to see which products they are and how many have been returned so far. Using the Orders and returns table, write a query to see top 5 most returned products from the company
SQL Query:
Select top (5) [Product Name],[Product ID], count(RI.[Order ID]) as [Product_Count]
FROM [MOVIES].[dbo].[Orders$] as OI
inner join [Returns$] as RI
on OI.[Order ID] = RI. [Order ID]
where returned = ‘Yes’
Group by [Product ID], [Product Name]
Order by count(RI.[Order ID]) desc;
Output:
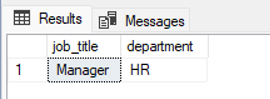
Question 19
Problem: Using the Employee dataset, please write a query to show the job title and department with the highest salary
SQL Query:
Select [job_title], [department]
FROM [Employee].[dbo].[Employee-Table]
where [salary] = (select max(salary) from [Employee].[dbo].[Employee-Table])
group by department, job_title;
Output:
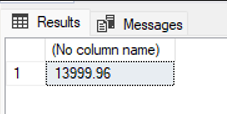
Problem: Write a query to find the 3rd highest sales from the sample superstore data
SQL Query:
Select Min (sales) FROM [MOVIES].[dbo].[‘Sample-Superstore-Complete$’]
where sales in (select top (3) sales FROM [MOVIES].[dbo].[‘Sample-Superstore-Complete$’] order by sales desc);
Output:
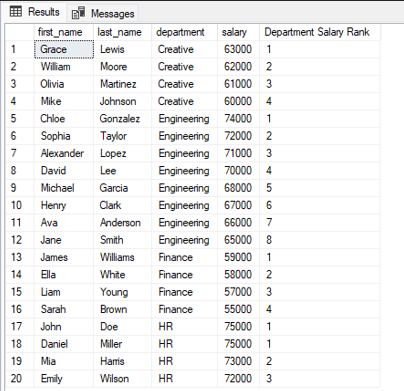
Question 20
Problem: Using the Employee dataset, write a query to determine the rank of employees based on their salaries in each department. For each department, find the employee(s) with the highest salary and rank them in Desc order.
SQL Query:
select [first_name], [last_name], [department], [salary],
DENSE_RANK() over (partition by department order by salary desc) as [Department Salary Rank]
FROM [Employee].[dbo].[Employee-Table];
Output: